
1、固态盘性能问题
客户的盘是 Intel NVMe 4TB 固态盘,通过 PCIe 总线连接,走 NVMe 协议。服务器正常跑 TIDB 数据库业务,iostat 监测,IOPS 只有 1000,带宽只有 5MB/s,而 %util 值持续为 100%,客户疑惑硬盘“满载”,为什么性能这么差?
1.1、固态盘基础知识
谈到出众的存储技术,NVMe 可谓独领风骚。看一眼,就会发现 NVMe 与 SATA 之间存在惊人的性能差别。NVMe 与 SATA 各自采用的通信驱动程序和接口完全不同,其中 SATA 采用的 AHCI 驱动程序是为采用旋转技术的机械硬盘设计的,而 NVMe 驱动程序专为采用闪存技术的固态硬盘设计。此外,NVMe 能够利用 PCIe 插槽,在存储接口与系统 CPU 之间进行通信,从而实现更高利用率。
1.1.1、SATA 固态硬盘
串行 ATA (SATA) 技术在 2000 年推出,对当时的并行 ATA 技术进行了改进。PATA 在电缆尺寸、成本、性能和功能存在局限性。这两项技术足够机械硬盘 (HDD) 使用,机械硬盘的表现远远落后于今天的固态硬盘 (SSD)。后来出现基于 SATA 的固态硬盘,证明了 ATA 总线已达到性能极限。机械硬盘只能实现 50-120 MB/秒的写入速度,而固态硬盘能达到 550 MB/秒的 SATA 总线极限值。尽管存在总线限制,使用基于 SATA 的固态硬盘替代旧机械硬盘技术,整体系统性能通常会提升 10 至 15 倍。
但是,SATA 是半双工接口,只能使用一个通道/方向传输数据,不能同时进行读和写功能,这可能会导致网络瓶颈和性能延迟。然而,SATA Revision 3.0(SATA 6Gb/s)引入了一种协议称为"Native Command Queuing"(NCQ),它允许在同一时间内进行多个传输命令,并且可以在传输过程中混合读取和写入操作。因此,通过NCQ,SATA在一定程度上可以实现并行数据传输,尽管仍然有一定的限制。此外,SATA 接口的错误恢复和报告功能也比 SAS 和 NVMe 接口少。
1.1.2、AHCI
高级主机控制器接口 (AHCI) 是在 2004 年前后推出的一种通信模式,用于改善由 SATA 连接的存储设备的性能和利用率。它专为机械硬盘设计,并引入一个存储请求队列,深度最高达到 32 条命令。这意味着机械硬盘可以实现更高的吞吐率和性能,但这种实现会成为未来固态硬盘控制器技术的瓶颈。例如,机械硬盘或许能够实现每秒 200 次输入/输出操作 (IOPS),而基于 SATA 的固态硬盘高达 100,000 IOPS,其性能受到 SATA 总线的限制。
1.1.3、SAS 固态硬盘
SAS (Serial Attached SCSI) 是新一代 SCSI 技术。SAS 接口与 SATA 接口一样,采用串行技术,传输速度更快,支持热插拔。用于支持企业级存储解决方案中硬件设备之间的 128 直接点对点数据传输。此外,SAS 是全双工接口,支持同时读写功能,双向数据传输速度可达 12Gb/s。
SAS 接口一般与 SATA 接口兼容。SAS 系统的背板既可以连接双端口高性能 SAS 硬盘,也可以连接高容量低成本 SATA 硬盘。通常,SAS 接口比 SATA 接口提供更高的吞吐量,支持更大的容量和更高的性能。
1.1.4、NVMe 固态硬盘
Non-Volatile Memory Express (NVMe) 技术在 2011 年推出,消除了 SATA 接口和通信协议的各种瓶颈。NVMe 技术利用 PCIe 总线,而不是 SATA 总线,可为存储设备释放巨大的带宽潜能。PCIe 4.0(最新版本)提供多达 32 个通道,理论上数据传输速度高达 64,000MB/秒,而 SATA III 规范最高为 600MB/秒。NVMe 规范还支持 65535 个命令队列,每个队列包含多达 65536 条命令。不要忘记,基于 SATA 的固态硬盘仅有一个队列,每个队列的深度仅为 32条命令。凭借更高的效率、性能以及在众多系统上的互操作性,NVMe 技术为存储设备创造了巨大潜力。人们普遍认为,这项技术将成为新的行业标准。
1.1.5、固态硬盘外形尺寸
机械硬盘通常宽 2.5 或 3.5 英寸,多数基于 SATA 的固态硬盘宽 2.5 英寸、厚 7 毫米,而 NVMe 固态硬盘支持多种新的外形尺寸,可以安装到各种不同的设备上。
- M.2 - 采用 M.2 外形尺寸的物理硬盘更小巧,这将确保这类存储设备在未来得到普及。22 是指宽度,30/42/80/110 是指长度,单位均为毫米。目前,M.2 2280 支持 SATA,也是面向 NVMe 的最常见的 NVMe 固态硬盘外形尺寸。随着技术的改进和产品尺寸的缩小,这可能会有所改变。
- U.2 - 这类存储设备价格更贵、性能更高、耐用性更久,通常应用于数据中心/企业存储环境。
- PCIe 插卡 - 这类高性能 NVMe 固态硬盘适用于未配备 M.2 外形尺寸兼容插槽的系统。
1.1.6、固态硬盘性能概览
NVMe 是专为固态硬盘而设计的存储协议。随着 SATA HBA 中间层的消失,NVMe 支持固态硬盘通过 PCIe 总线直接与 CPU 通信,为实现突破性的性能提升创造了条件。客观上看,SATA III 总线的性能极限是 6Gb/秒,这意味着一块 SATA 固态硬盘在剔除开销后最高提供 550MB/秒的吞吐率。单个 PCIe 3.0 通道可以提供 1GB/秒(双向)的吞吐率,因此,PCIe 3x4 固态硬盘可以提供高达 4GB/秒读取/写入吞吐率。PCIe Gen 4X4 固态硬盘则高达 8GB/秒(双向)。在这种情况下,限制性能的因素从协议变成 NAND 介质,而这种介质近年来取得了巨大发展,让制造商能够将最高的密度和性能塞进最小的外形尺寸。
NVMe 也大幅降低了协议延迟,得益于经过缩短和优化的数据路径实现比 SATA/SAS 小的延迟。NVMe 设备中的队列管理也得到 CPU 更高效的处理,得益于 I/O 处理门铃信号发送机制大幅降低了 CPU 开销。此外,得益于过去十年的大规模开发工作,NVMe 设备也得到多数主要操作系统的支持。
1.1.7、接口对比
通常,网络服务器有两个标准接口协议:NVMe 和高级主机控制器接口(Advanced Host Controller interface, AHCI)。服务器的 NVMe 接口使用 NVMe 接口协议,服务器的 SATA 和 SAS 接口使用 AHCI 接口协议,同时支持 IDE (Integrated Development Environment)。
此外,服务器接口端口也各不相同。NVMe 接口只支持 PCIe 接口,SAS 接口支持 M.2、U.2、mSATA、SATA、SAS、PCI-E、SATA express、IDE 接口,SATA 接口支持 SATA、U.2、M.2 接口。此外,NVMe SSD 接口使用的 PCIe 总线通道可以直接连接到 CPU,而其他两个通道则不能。
Read/Write 速度:
| SATA | SAS | NVMe | |
|---|---|---|---|
| throughput | 600MB/s | 1200MB/s | 3.9GB/s |
| Interface rate | 6Gb/s | 12Gb/s | 32Gb/s |
1.2、客户现场测试
环境:CPU arm64v8a 64核,内存 256G,操作系统 Centos7.5,固态盘 480G SATA(盘符为 /dev/sde),RAID卡 JBOD 模式。
iostat 官网:https://github.com/sysstat/sysstat
1.2.1、裸盘顺序写测试
测试命令:
# fio -name=W16K -filename=/dev/sde -direct=1 -iodepth=20 -rw=write -ioengine=libaio -bs=16k -size=10G -thread -numjobs=32 -runtime=300 -group_reporting

测试结果:
W16K: (g=0): rw=write, bs=(R) 16.0KiB-16.0KiB, (W) 16.0KiB-16.0KiB, (T) 16.0KiB-16.0KiB, ioengine=libaio, iodepth=20
...
fio-3.7
Starting 32 threads
Jobs: 32 (f=32): [W(32)][100.0%][r=0KiB/s,w=392MiB/s][r=0,w=25.1k IOPS][eta 00m:00s]
W16K: (groupid=0, jobs=32): err= 0: pid=16013: Mon Jul  3 14:01:02 2023
  write: IOPS=23.5k, BW=368MiB/s (386MB/s)(108GiB/300026msec)
    slat (usec): min=3, max=3287, avg= 7.37, stdev= 8.17
    clat (usec): min=342, max=93150, avg=27176.94, stdev=2683.35
     lat (usec): min=357, max=93211, avg=27184.53, stdev=2683.37
    clat percentiles (usec):
     |  1.00th=[21627],  5.00th=[22676], 10.00th=[23725], 20.00th=[24773],
     | 30.00th=[25822], 40.00th=[26608], 50.00th=[27132], 60.00th=[27919],
     | 70.00th=[28705], 80.00th=[29492], 90.00th=[30540], 95.00th=[31589],
     | 99.00th=[33424], 99.50th=[33817], 99.90th=[35390], 99.95th=[35914],
     | 99.99th=[38011]
   bw (  KiB/s): min=10240, max=13636, per=3.12%, avg=11769.03, stdev=597.01, samples=19200
   iops        : min=  640, max=  852, avg=735.54, stdev=37.32, samples=19200
  lat (usec)   : 500=0.01%
  lat (msec)   : 4=0.01%, 10=0.01%, 20=0.25%, 50=99.74%, 100=0.01%
  cpu          : usr=0.32%, sys=0.65%, ctx=2010978, majf=0, minf=32
  IO depths    : 1=0.1%, 2=0.1%, 4=0.1%, 8=0.1%, 16=100.0%, 32=0.0%, >=64=0.0%
     submit    : 0=0.0%, 4=100.0%, 8=0.0%, 16=0.0%, 32=0.0%, 64=0.0%, >=64=0.0%
     complete  : 0=0.0%, 4=100.0%, 8=0.0%, 16=0.0%, 32=0.1%, 64=0.0%, >=64=0.0%
     issued rwts: total=0,7062829,0,0 short=0,0,0,0 dropped=0,0,0,0
     latency   : target=0, window=0, percentile=100.00%, depth=20

Run status group 0 (all jobs):
  WRITE: bw=368MiB/s (386MB/s), 368MiB/s-368MiB/s (386MB/s-386MB/s), io=108GiB (116GB), run=300026-300026msec

Disk stats (read/write):
  sde: ios=10/579078, merge=0/5739709, ticks=50/15980130, in_queue=16192610, util=100.00%

测试过程iostat监控结果:
07/03/2023 02:00:39 PM
Device:         rrqm/s   wrqm/s     r/s     w/s    rkB/s    wkB/s avgrq-sz avgqu-sz   await r_await w_await  svctm  %util
sda               0.00     0.20    0.00    0.80     0.00     8.00    20.00     0.00    0.00    0.00    0.00   0.00   0.00
sde               0.00 18954.80    0.00 1999.40     0.00 380300.80   380.41    54.87   27.21    0.00   27.21   0.50 100.60
测试结果参数比较多,取客户关心的参数进行分析,裸盘顺序写测试 IOPS 为 23.5K,BW 为 386MB/s,%util 参数持续为 100%。
1.2.2、裸盘随机写测试
测试命令:
# fio -name=W1K -filename=/dev/sde -direct=1 -iodepth=20 -rw=randwrite -ioengine=libaio -bs=1k -size=10G -thread -numjobs=32 -runtime=300 -group_reporting

测试结果:
W1K: (g=0): rw=randwrite, bs=(R) 1024B-1024B, (W) 1024B-1024B, (T) 1024B-1024B, ioengine=libaio, iodepth=20
...
fio-3.7
Starting 32 threads
Jobs: 32 (f=32): [w(32)][100.0%][r=0KiB/s,w=45.5MiB/s][r=0,w=46.6k IOPS][eta 00m:00s]
W1K: (groupid=0, jobs=32): err= 0: pid=16296: Mon Jul  3 14:11:05 2023
  write: IOPS=46.2k, BW=45.2MiB/s (47.4MB/s)(13.2GiB/300002msec)
    slat (usec): min=4, max=33090, avg=682.25, stdev=592.53
    clat (usec): min=3, max=62923, avg=13152.05, stdev=1956.62
     lat (usec): min=389, max=65252, avg=13835.12, stdev=2029.79
    clat percentiles (usec):
     |  1.00th=[ 3621],  5.00th=[11338], 10.00th=[11994], 20.00th=[12518],
     | 30.00th=[12780], 40.00th=[13042], 50.00th=[13304], 60.00th=[13435],
     | 70.00th=[13698], 80.00th=[13960], 90.00th=[14484], 95.00th=[14877],
     | 99.00th=[17957], 99.50th=[21627], 99.90th=[28443], 99.95th=[31327],
     | 99.99th=[38011]
   bw (  KiB/s): min= 1327, max= 2092, per=3.12%, avg=1444.81, stdev=68.95, samples=19185
   iops        : min= 1327, max= 2092, avg=1444.81, stdev=68.95, samples=19185
  lat (usec)   : 4=0.01%, 250=0.01%, 500=0.01%, 750=0.04%, 1000=0.08%
  lat (msec)   : 2=0.41%, 4=0.53%, 10=1.81%, 20=96.45%, 50=0.68%
  lat (msec)   : 100=0.01%
  cpu          : usr=0.51%, sys=94.96%, ctx=437176, majf=0, minf=32
  IO depths    : 1=0.1%, 2=0.1%, 4=0.1%, 8=0.1%, 16=100.0%, 32=0.0%, >=64=0.0%
     submit    : 0=0.0%, 4=100.0%, 8=0.0%, 16=0.0%, 32=0.0%, 64=0.0%, >=64=0.0%
     complete  : 0=0.0%, 4=100.0%, 8=0.0%, 16=0.0%, 32=0.1%, 64=0.0%, >=64=0.0%
     issued rwts: total=0,13873231,0,0 short=0,0,0,0 dropped=0,0,0,0
     latency   : target=0, window=0, percentile=100.00%, depth=20

Run status group 0 (all jobs):
  WRITE: bw=45.2MiB/s (47.4MB/s), 45.2MiB/s-45.2MiB/s (47.4MB/s-47.4MB/s), io=13.2GiB (14.2GB), run=300002-300002msec

Disk stats (read/write):
  sde: ios=4/13867067, merge=0/24, ticks=0/9854550, in_queue=9897750, util=100.00%

测试过程iostat监控结果:
07/03/2023 02:19:01 PM
Device:         rrqm/s   wrqm/s     r/s     w/s    rkB/s    wkB/s avgrq-sz avgqu-sz   await r_await w_await  svctm  %util
sda               0.00     0.00    0.00    0.00     0.00     0.00     0.00     0.00    0.00    0.00    0.00   0.00   0.00
sde               0.00     1.20    0.00 50302.40     0.00 50302.20     2.00   109.68    2.17    0.00    2.17   0.02 100.20
测试结果参数比较多,取客户关心的参数进行分析,裸盘随机写测试 IOPS 为 46.2K,BW 为 47.4MB/s,%util 参数持续为 100%。
1.2.3、文件系统顺序写测试
测试命令:
# fio -name=FW16K -filename=/mnt/sde/fw16k.txt -direct=1 -iodepth=20 -rw=write -ioengine=libaio -bs=16k -size=10G -thread -numjobs=32 -runtime=300 -group_reporting

测试结果:
FW16K: (g=0): rw=write, bs=(R) 16.0KiB-16.0KiB, (W) 16.0KiB-16.0KiB, (T) 16.0KiB-16.0KiB, ioengine=libaio, iodepth=20
...
fio-3.7
Starting 32 threads
FW16K: Laying out IO file (1 file / 10240MiB)
Jobs: 32 (f=32): [W(32)][100.0%][r=0KiB/s,w=383MiB/s][r=0,w=24.5k IOPS][eta 00m:00s]
FW16K: (groupid=0, jobs=32): err= 0: pid=19531: Mon Jul  3 16:45:03 2023
  write: IOPS=24.5k, BW=383MiB/s (401MB/s)(112GiB/300027msec)
    slat (usec): min=6, max=217, avg=13.60, stdev= 4.00
    clat (usec): min=806, max=55579, avg=26116.39, stdev=4061.30
     lat (usec): min=903, max=55589, avg=26130.25, stdev=4061.49
    clat percentiles (usec):
     |  1.00th=[17433],  5.00th=[19530], 10.00th=[20841], 20.00th=[22676],
     | 30.00th=[23725], 40.00th=[25035], 50.00th=[26084], 60.00th=[27132],
     | 70.00th=[28181], 80.00th=[29492], 90.00th=[31327], 95.00th=[32900],
     | 99.00th=[35914], 99.50th=[36963], 99.90th=[39584], 99.95th=[40633],
     | 99.99th=[43254]
   bw (  KiB/s): min=10112, max=14496, per=3.12%, avg=12243.87, stdev=747.69, samples=19200
   iops        : min=  632, max=  906, avg=765.21, stdev=46.74, samples=19200
  lat (usec)   : 1000=0.01%
  lat (msec)   : 2=0.01%, 4=0.01%, 10=0.01%, 20=6.38%, 50=93.62%
  lat (msec)   : 100=0.01%
  cpu          : usr=0.31%, sys=1.20%, ctx=4296391, majf=0, minf=32
  IO depths    : 1=0.1%, 2=0.1%, 4=0.1%, 8=0.1%, 16=100.0%, 32=0.0%, >=64=0.0%
     submit    : 0=0.0%, 4=100.0%, 8=0.0%, 16=0.0%, 32=0.0%, 64=0.0%, >=64=0.0%
     complete  : 0=0.0%, 4=100.0%, 8=0.0%, 16=0.0%, 32=0.1%, 64=0.0%, >=64=0.0%
     issued rwts: total=0,7347877,0,0 short=0,0,0,0 dropped=0,0,0,0
     latency   : target=0, window=0, percentile=100.00%, depth=20

Run status group 0 (all jobs):
  WRITE: bw=383MiB/s (401MB/s), 383MiB/s-383MiB/s (401MB/s-401MB/s), io=112GiB (120GB), run=300027-300027msec

Disk stats (read/write):
  sde: ios=0/521688, merge=0/6251081, ticks=0/15249580, in_queue=15396670, util=100.00%

测试过程iostat监控结果:
07/03/2023 04:26:06 PM
Device:         rrqm/s   wrqm/s     r/s     w/s    rkB/s    wkB/s avgrq-sz avgqu-sz   await r_await w_await  svctm  %util
sda               0.00     0.00    0.00    0.00     0.00     0.00     0.00     0.00    0.00    0.00    0.00   0.00   0.00
sde               0.00 21473.20    0.00 1795.60     0.00 403905.60   449.88    51.43   28.34    0.00   28.34   0.56 100.00
测试结果参数比较多,取客户关心的参数进行分析,文件系统顺序写测试 IOPS 为 24.5K,BW 为 401MB/s,%util 参数持续为 100%。
1.2.4、文件系统随机写测试
测试命令:
# fio -name=FW1K -filename=/mnt/sde/fw1k.txt -direct=1 -iodepth=20 -rw=randwrite -ioengine=libaio -bs=1k -size=10G -thread -numjobs=32 -runtime=300 -group_reporting

测试结果:
FW1K: (g=0): rw=randwrite, bs=(R) 1024B-1024B, (W) 1024B-1024B, (T) 1024B-1024B, ioengine=libaio, iodepth=20
...
fio-3.7
Starting 32 threads
FW1K: Laying out IO file (1 file / 10240MiB)
Jobs: 32 (f=32): [w(32)][100.0%][r=0KiB/s,w=15.5MiB/s][r=0,w=15.9k IOPS][eta 00m:00s]
FW1K: (groupid=0, jobs=32): err= 0: pid=19360: Mon Jul  3 16:36:19 2023
  write: IOPS=13.4k, BW=13.1MiB/s (13.7MB/s)(3933MiB/300002msec)
    slat (usec): min=42, max=116879, avg=2379.22, stdev=526.84
    clat (usec): min=41, max=155238, avg=45282.57, stdev=5679.32
     lat (usec): min=528, max=157371, avg=47662.11, stdev=5948.29
    clat percentiles (msec):
     |  1.00th=[   39],  5.00th=[   39], 10.00th=[   40], 20.00th=[   41],
     | 30.00th=[   42], 40.00th=[   43], 50.00th=[   45], 60.00th=[   46],
     | 70.00th=[   49], 80.00th=[   52], 90.00th=[   53], 95.00th=[   54],
     | 99.00th=[   54], 99.50th=[   55], 99.90th=[   96], 99.95th=[  106],
     | 99.99th=[  155]
   bw (  KiB/s): min=  329, max=  500, per=3.12%, avg=419.34, stdev=46.59, samples=19176
   iops        : min=  329, max=  500, avg=419.34, stdev=46.59, samples=19176
  lat (usec)   : 50=0.01%, 100=0.01%, 250=0.01%, 750=0.01%
  lat (msec)   : 2=0.01%, 4=0.01%, 10=0.01%, 20=0.01%, 50=75.09%
  lat (msec)   : 100=24.82%, 250=0.08%
  cpu          : usr=0.20%, sys=1.22%, ctx=8056206, majf=0, minf=32
  IO depths    : 1=0.1%, 2=0.1%, 4=0.1%, 8=0.1%, 16=100.0%, 32=0.0%, >=64=0.0%
     submit    : 0=0.0%, 4=100.0%, 8=0.0%, 16=0.0%, 32=0.0%, 64=0.0%, >=64=0.0%
     complete  : 0=0.0%, 4=100.0%, 8=0.0%, 16=0.0%, 32=0.1%, 64=0.0%, >=64=0.0%
     issued rwts: total=0,4027891,0,0 short=0,0,0,0 dropped=0,0,0,0
     latency   : target=0, window=0, percentile=100.00%, depth=20

Run status group 0 (all jobs):
  WRITE: bw=13.1MiB/s (13.7MB/s), 13.1MiB/s-13.1MiB/s (13.7MB/s-13.7MB/s), io=3933MiB (4125MB), run=300002-300002msec

Disk stats (read/write):
  sde: ios=0/4033536, merge=0/3090015, ticks=0/161490, in_queue=159780, util=51.64%

测试过程iostat监控结果:
07/03/2023 04:32:56 PM
Device:         rrqm/s   wrqm/s     r/s     w/s    rkB/s    wkB/s avgrq-sz avgqu-sz   await r_await w_await  svctm  %util
sda               0.00     0.00    0.00    0.00     0.00     0.00     0.00     0.00    0.00    0.00    0.00   0.00   0.00
sde               0.00 12176.00    0.00 12337.60     0.00 36745.00     5.96     0.45    0.04    0.00    0.04   0.04  44.60
测试结果参数比较多,取客户关心的参数进行分析,文件系统随机写测试 IOPS 为 13.4K,BW 为 13.7MB/s,%util 参数持续为 50%。
1.2.5、结果对比分析
| 样例 | 测试项目 | iops | bandwidth | w_await | util |
|---|---|---|---|---|---|
| 1 | 裸盘顺序写 | 23.5K | 386MB/s | 27.21ms | 100% |
| 2 | 裸盘随机写 | 46.2K | 47.4MB/s | 2.17ms | 100% |
| 3 | 文件系统顺序写 | 24.5K | 401MB/s | 28.34ms | 100% |
| 4 | 文件系统随机写 | 13.4K | 13.7MB/s | 0.04ms | 50% |
IO 性能主要关注读写 IOPS、带宽、延迟这三个重要指标,读写方式不同得到的结果也不相同。
样例 1 和 3 是大块顺序写,主要是为了测出带宽,为 400 MB/s 左右。
样例 2 和 4 是小块随机写,主要是为了测出 iops,为 46000 左右。样例 4 为什么差别巨大?因为通过文件系统写数据时,特别是小块写,会产生大量的文件系统元数据开销,性能降低。另外,测试过程中,我打开了 5 个终端,同时使用样例 4 中的指令写 5 个不同的文件,iops 才接近样例 2。
综合测试结果,可以判定客户当前的服务器在磁盘 IO 写层面没有异常,并且性能良好。
1.3、iostat %util 释疑
1.3.1、iostat %util 项的计算方式
通过查看 sysstat 的源代码(可以从 https://github.com/sysstat/sysstat 获取),iostat 中 %util 数值的计算代码如下:
common.c 文件的 685 行,
xds->util = S_VALUE(sdp->tot_ticks, sdc->tot_ticks, itv);
从上述代码可以知道,%util 是计算一段时间间隔 itv 内,开始和结束时的 tot_ticks 之差同 itv 的比率。而 tot_tick 这个数据,读取自 /proc/diskstatus 文件的 Field 10,通过参照 Linux 内核 doc (https://www.kernel.org/doc/Documentation/iostats.txt),可以知道 Field 10 的意义:
Field 9 -- # of I/Os currently in progress
The only field that should go to zero. Incremented as requests are given to appropriate struct request_queue and decremented as they finish.

Field 10 -- # of milliseconds spent doing I/Os
This field increases so long as field 9 is nonzero.
Linux 内核每个 tick 会检查是否有正在处理的 IO 请求,如果有,就将 Field 10 自增。
S_VALUE(sdp->tot_ticks, sdc->tot_ticks, itv) 展开以后,等于:(sdc->tot_ticks – sdp->tot_ticks ) / itv * HZ。
所以,%util 的意义是一段时间内,有 IO 请求正在处理(设备工作)的时间 ticks 占总时间的比率,%util 其实就是 %busy,其值在 0%~100% 之间。
1.3.2、%util 项的意义
%util 项的意义是说明,在一段时间内,设备处于运转(BUSY)状态的时间比率。在 iostat 手册上,关于这一项的意义如下:
%util
Percentage of CPU time during which I/O requests were issued to the device (bandwidth utilization for the device). Device saturation occurs when this value is close to 100%.
最后一句是关于%util 意义的一些误解的来源。
同 iostat 作者 Sebastien GODARD 沟通得知,iostat 程序和手册是他在 15 年前写的,那时候还没有 SSD 这种设备,RAID 阵列也没有广泛使用,他对磁盘的理解是基于传统机械硬盘的。
传统机械硬盘由于其处理 IO 基本上是串行的,每一时刻只能处理 1 个请求,所以当 %util 接近 100% 时,硬盘的处理能力就达到上限了。
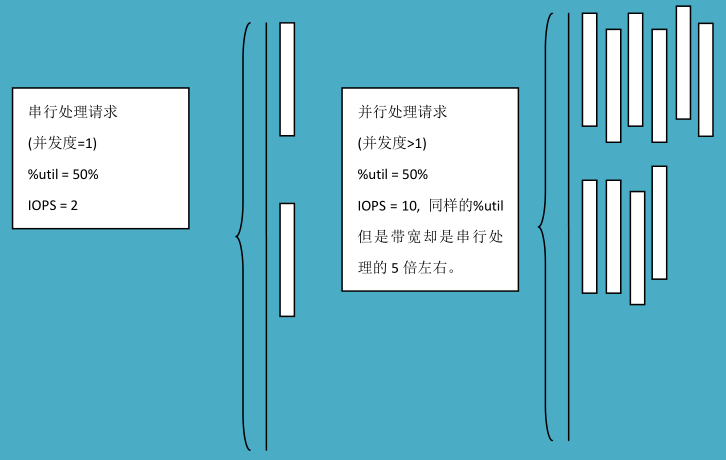
但是对于 SSD 和 RAID 阵列这些可以并行同时处理很多 IO 请求的设备来说,%util 就只能反映设备 BUSY 的状态的时间比,而不能反映设备的处理能力。如下图所示,显示了 1 秒时间间隔内串行处理请求和并行处理请求的区别:
通过和 iostat 作者 Sebastien GODARD 沟通交流,他也意识到在 15 年前写的帮助手册有些歧义,将会在新版本帮助手册中,将 Device saturation occurs when this value is close to 100%. 修改为类似如下更加精确的表述: Device saturation occurs when this value is close to 100% for devices serving requests serially. But for devices serving requests in parallel, such as RAID arrays and modern SSDs, this number does not reflect their performance limits.